3 Tools to Buy the Dip: S&P500, VIX, and Google Trends - DataDrivenInvestor
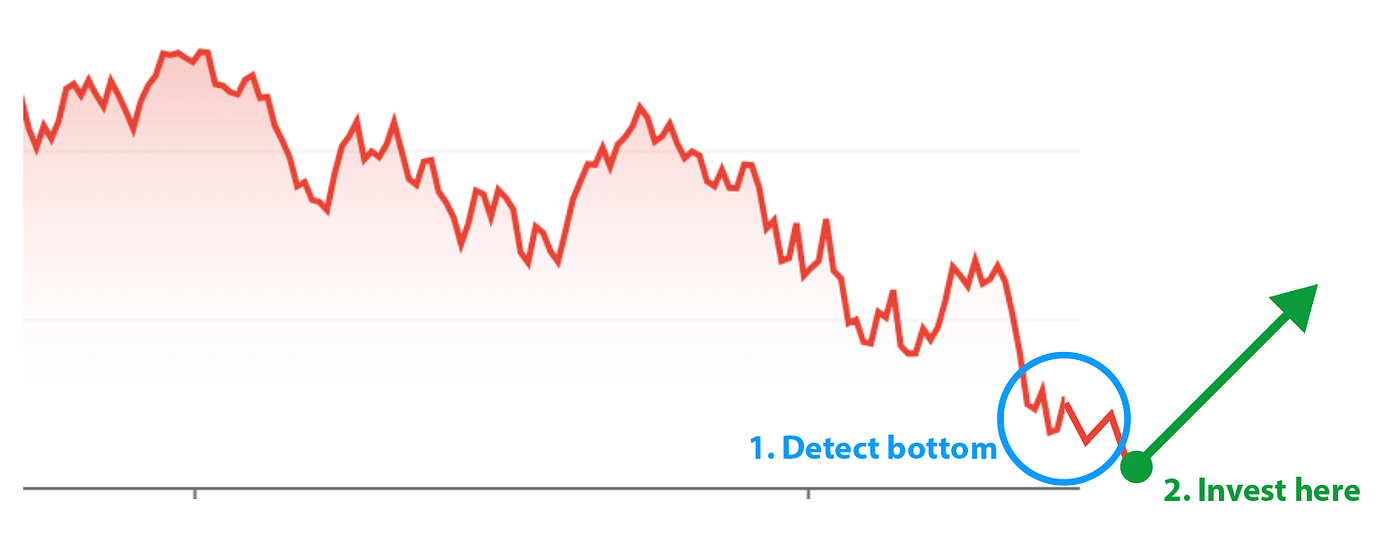
Wait, buy, hold, profit.
Throughout nearly 100 years of stock market history, there have been 15 recessions, with the most notable ones being The Great Depression of 1929–39, the oil price shock of 1973, the dot-com bubble of 2000, and the financial crisis of 2007–08. Here are all the recessions highlighted in grey:

The upside of having such few occurrences is that it's fairly easy to identify common factors to each of these crises and to therefore anticipate where the bottom of the one we're currently going through might be. The downside of such few occurrences is that we can't be certain that the factors we think we've identified actually mean anything in the long term. Maybe the factors common to those few crises would turn out to be random and irrelevant if we had a bigger sample of 100 crises. But we barely even have a century of stock market historical data to look back on, and the best way to predict the future is always to look at the past and analyze the present.
Now, I'm not a "stock expert". I didn't study economics, I studied art. I don't work in a bank, I'm a graphic designer. I'm just a guy who loves data, finding patterns, coding for fun, and running algorithms on spreadsheets. I also love socio-economics but again I am not an "expert" in any of those fields, and none of the insights contained in this article should be considered financial advice.
A little backstory
In 2020, as the world shut down during the pandemic and the markets collapsed, I thought it was finally time for me to invest in the stock market. Every stock was on discount, I had a good savings account, no big purchases coming up, so I figured I should put my money to work. The news headlines were crazy, each predicting the end of the world to a varying degree. Then, the S&P 500 lost more than 20% of its peak value within a few months, technically marking the official start of a recession. I remember looking at the chart and thinking to myself: "It's going to drop a lot more than that, I should wait before buying anything". Little did I know, this would turn out to be the shortest recession in history.
Only a month after losing a third of its value, the S&P500 picked up steam again and went on a historical bull ride, doubling in value within the next 18 months. I had been scared to buy and now it was too late to catch up.

This year, the S&P just entered bear market territory again, meaning it lost 20% in value from its recent peak and is now expected to follow a downtrend for a little while. I don't want to miss the ride one more time, so here's the strategy I put together to hopefully win at the stock market game and invest at the right time.
On so-called "experts"
The stock market is nothing more but a game. It's a game that makes the world go round, but it's still just a game. There is one very important premise to my strategy and insights in general: experts know nothing of where the market is going. Don't get me wrong, most of them understand how the game works, they know the economy, have been to the best schools… But all they do from day to day is try their luck at the game, apply their learnings and what they think is true to a trading strategy. At the end of the day, some of them turn out to be right and make a ton of money, and most of them turn out to be wrong and lose a ton of money.
Nobody knows where the stock market is going, but anybody can do like the experts: act like we know based on what we think we know. The reality is that a lot of the most successful hedge-fund managers in the world owe their fortunes to a few lucky bets or from the fees they get from betting other people's money, not from being right all the time. Here are a few examples:
- Warren Buffet bought Coca-Cola stock 33 years ago and is up 2000% thanks to this one position. This massive gain can easily cover potential losses.
- George Soros made a profit of $1 billion thanks to one short sale during the 1992 Black Wednesday UK currency crisis. This accounts for more than 10% of his current net worth.
- Ray Dalio gathered the funds necessary to start his investment firm from fees he collected at a previous hedge fund where he managed other people's money.
It's very easy to think experts are always right because the news makes it seem so. When you think about it, it's not in their best interest to give air time to people who turn out to be wrong and don't know what they're talking about. So if an expert makes a prediction and it doesn't happen, they won't come back to it. But if the expert turns out to be right, they'll happily feature his story on their front page.
Always remember that at the end of the day, the stock goes either up or down, and everyone has the same 50% chance of being wrong or right. Remember this when you read predictions, including mine.
With that in mind, let's get started with my strategy, and look at the 3 indicators it's based on.
The strategy
The strategy is based on 3 indicators, and I am 99% confident that when the right setup is shown by all 3 of them, there will be an opportunity for long-term profit. The goal is to buy the S&P500 a few days after the setup is detected (to confirm the trend) and then hold for a few years after that. We want to slowly ride the wave out of this crisis.
Indicator #1: S&P 500
The S&P 500 is a stock market index tracking the stock performance of 504 of the largest companies in America. It is one of the most commonly followed equities indices because it gives a clear picture of what the economy is looking like. Every time there's been a crisis, the S&P has dropped in value, and every time the economy has been doing great, it has gained in value. If we look at it on a broad timeline, there were no major drops from 1957 (when the index was created) to 2000 and only a handful of major drops after that:
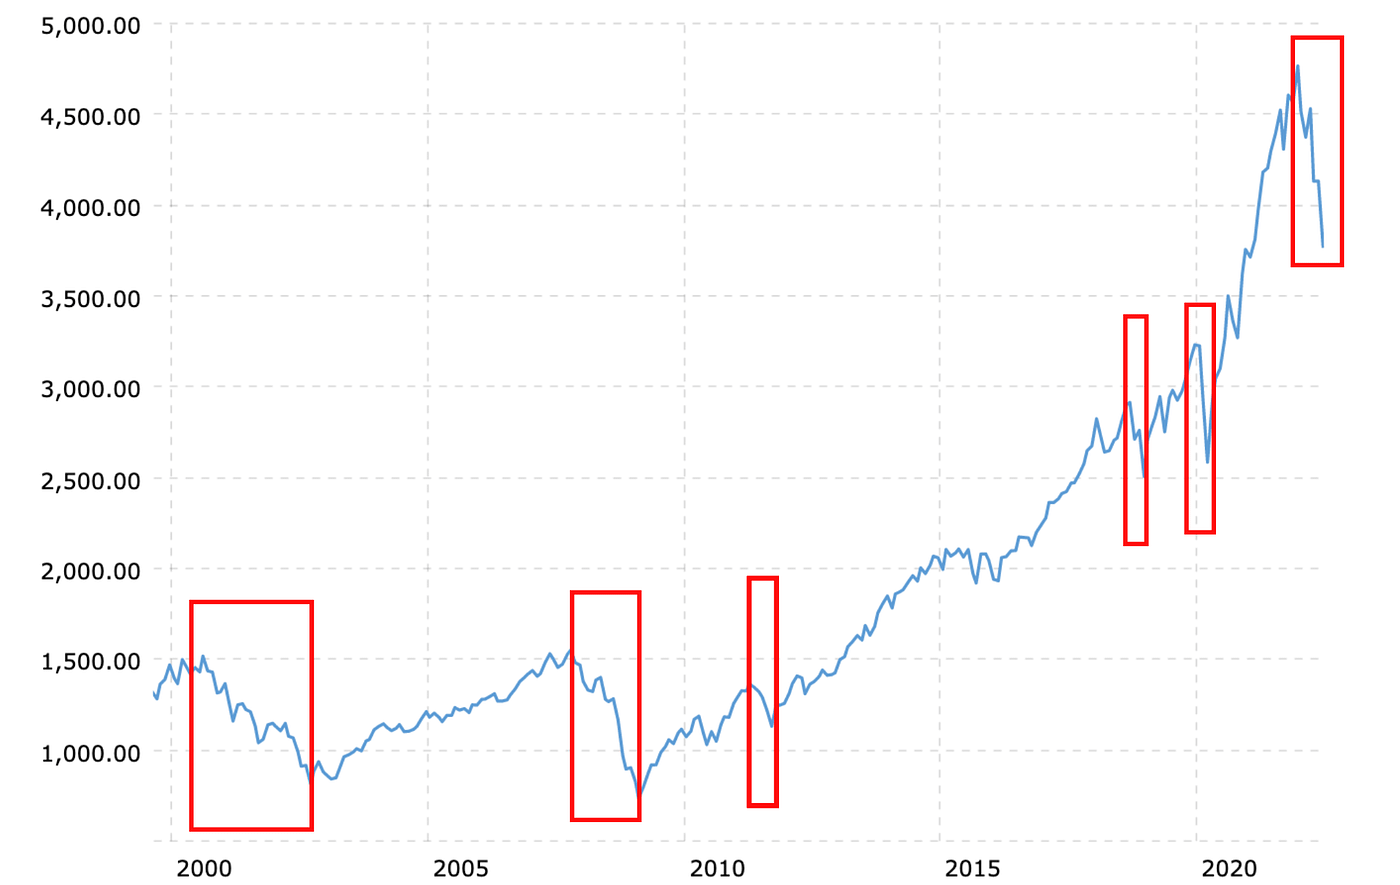
This is our first learning: the S&P 500 doesn't drop often. In fact, it has only dropped more than 1% 242 out of 784 months since its inception 65 years ago. In June 2022, it is on track to close the month with at least a 10% drop in value, and this has only happened 9 times since 1957. We know this from looking at the publicly available historical data of the S&P 500.
This gives us another clear insight: we are living in a very rare economical context, and what is rare is usually unknown. But we do know that 8 times out of 9 the S&P 500 has dropped more than 10%, it yielded a positive return on investment within less than 10 months. This means that if you had bought the index every time it dropped 10% or more, you would have made a profit in less than a year except for one time (in the 70s). Even for this one time, you would have made a profit in less than a few years (remember we're working on a long-term strategy here).
Here is the data I'm talking about loaded up in a spreadsheet:
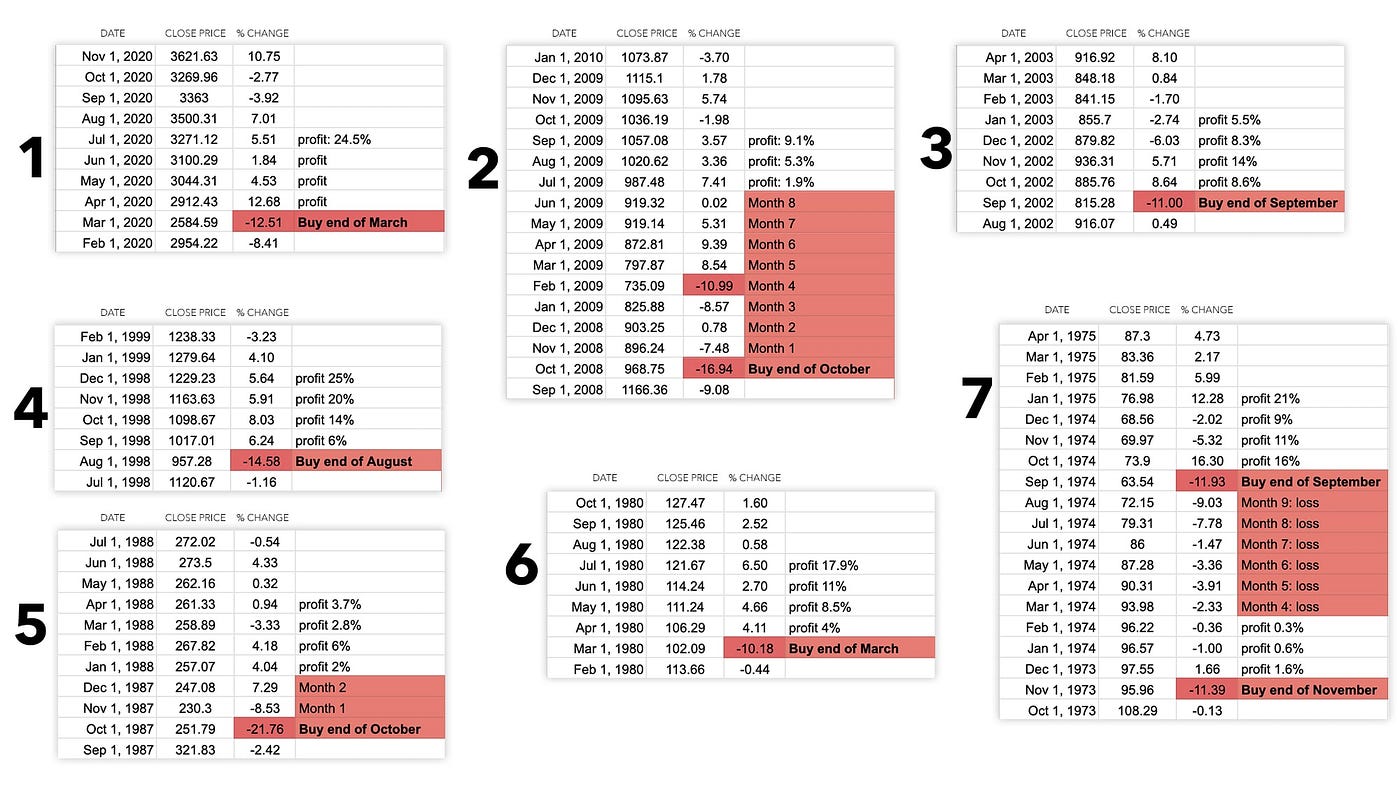
For each image, the first column from the left indicates the month of the data point. The second column from the left indicates the price of the S&P 500 at the end of the given month. The third column shows the percentage change of the S&P 500 value from the beginning of the given month to the end of it. For instance, in March 2020 (image #1) the S&P 500 dropped 12.51%.
As I'm writing this article, the S&P 500 is down nearly 9% since the beginning of the month. I don't know about you, but this makes me think the end of this month would be a great time to invest. But I'm not the kind to be convinced with only one argument, so let's look at our next indicator.
Indicator #2: VIX
Now that we've identified what makes a crisis and how rare the economic opportunity unfolding before our eyes is, it would be great to be more precise about when exactly the market will bounce back. To do that, we're going to look at something called VIX.
VIX is an index that tracks the volatility of the market. In the securities markets, volatility is often associated with big swings in either direction. For example, when the stock market rises and falls more than one percent over a sustained period of time, it is called a volatile market.
Generally speaking, a VIX value above 20–25 is considered representative of a volatile market. Always remember that the market is an amazing indicator of crowd sentiment, and when times get tough and a crisis arises most people panic, which increases the volatility of the market. Prices go up and down, people sell things for lower than they bought them for because they want to cash out, afraid that their share of the economic pie is going to lose even more value.
Every time there's been a decline in the market, whether a crisis or a small correction, the VIX has increased. And every time, the market has started to rebound shortly after a VIX value of 40–45.
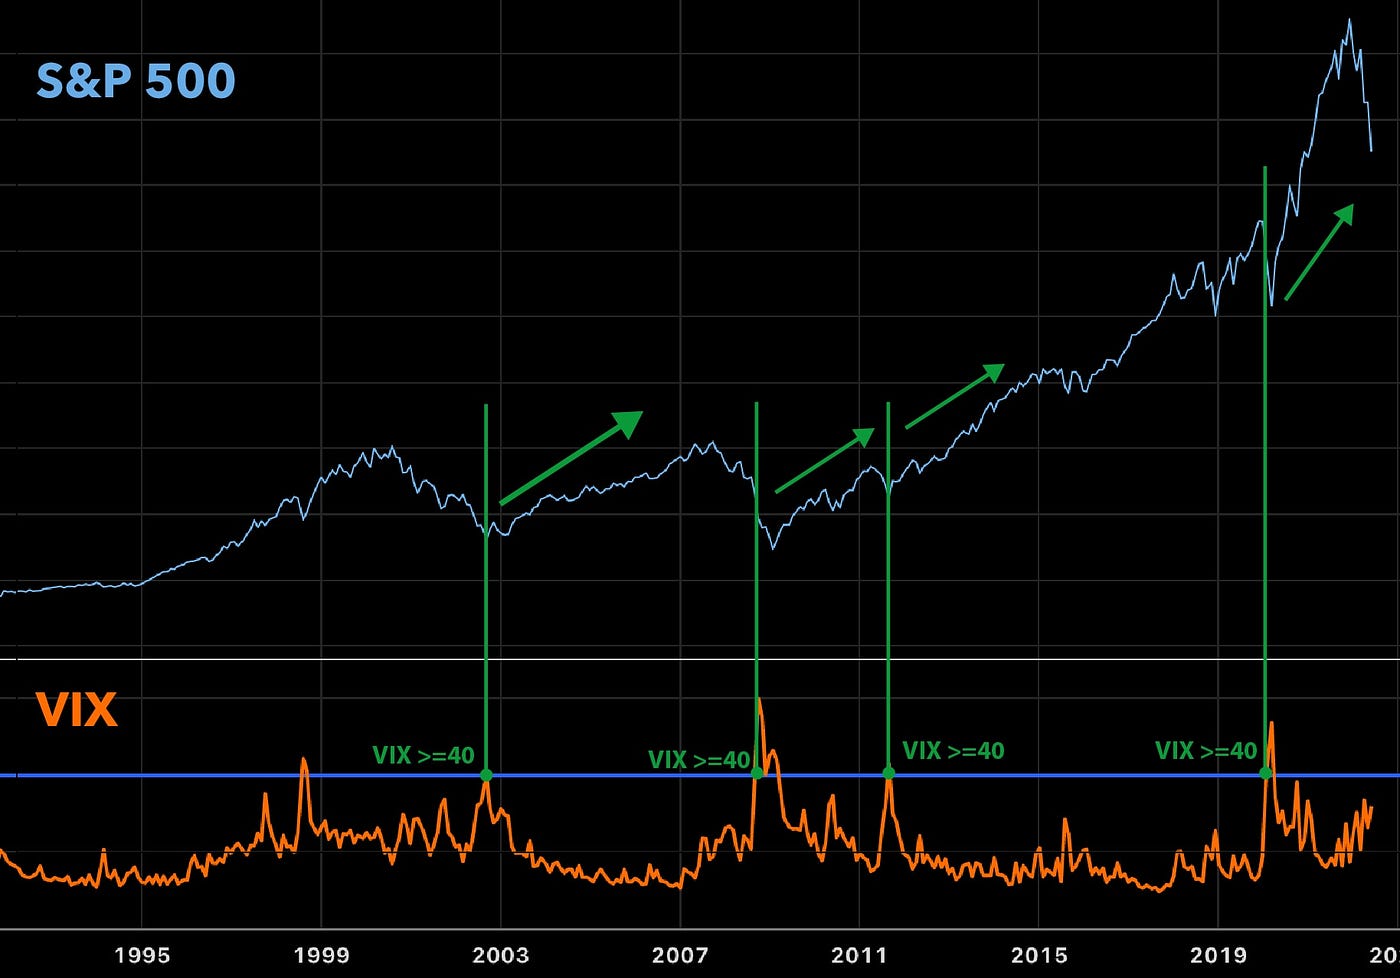
Here is what it looks if we add this data to our spreadsheet:
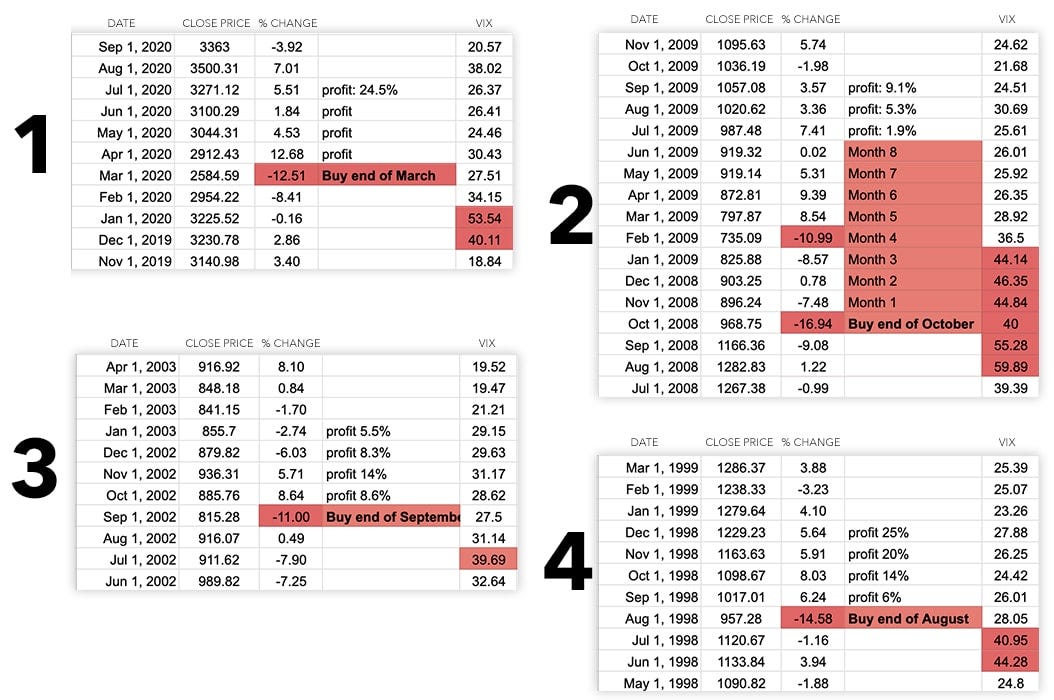
Note: the picture above doesn't include as many examples as the previous spreadsheet image because the VIX didn't exist before 1993.
As I'm writing this article, the VIX is at 30.5, which gives us an essential piece of information: although the S&P 500 looks like it might close below a 10% month-to-month drop, and although it has always recovered from such a drop within 7 months or less, the market is not volatile enough to indicate a rebound yet. In other words, there needs to be more panic first, it looks like it's still too early to place our bets.
The question then becomes: how do we know if people are still panicking?
Indicator #3: Google Trends
Google Trends is probably the second-best tool after the stock market to know what people are thinking because people search for most of everything they think about online. What do you do if you want to know if a recession is coming? You go to Google and research it.
By looking at Google's publicly available data on top search queries in its search engine all around the world, we can see that a lot of people are looking up the term "recession" right now. In fact, June 2022 is on track to see the biggest "recession" hits since Google Trends was created in 2004:
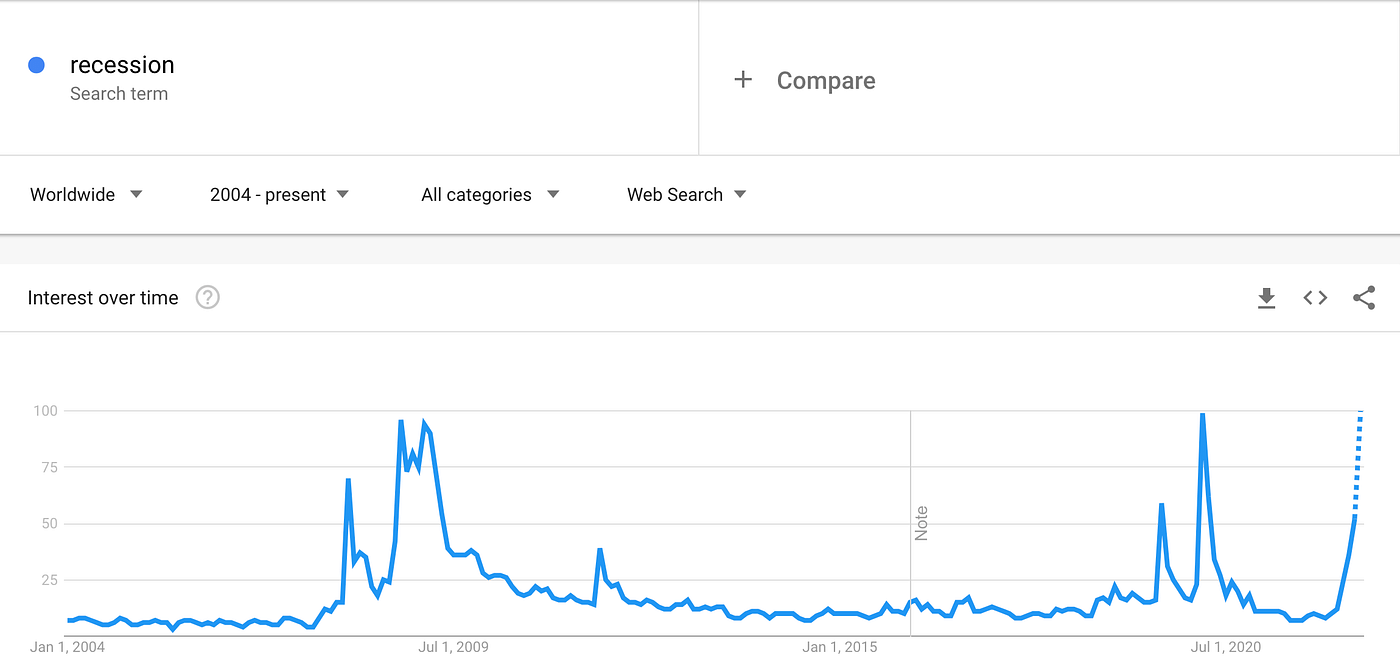
In data analysis, a very important component to understand is something called the baseline: a minimum or starting point which gives us something to compare our whole data to, rather than just saying "This is high", or "This is low". It's very important to not confuse baseline with average, which is a number obtained with a mathematical formula that expresses the central or typical value in a set of data. A baseline can be arbitrary and does not have to be mathematically proven.
Looking at the data from Google Trends, we can consider a baseline below 15–20 to be reasonable, because we can see that corresponds to a rather usual search volume in normal times. People usually don't care that much about a recession, but when times get tough (like during the 2008–09 crisis or during the pandemic), then they start to worry, and the graph spikes accordingly. We can conclude that when people start looking up the term "recession" more and more, a recession becomes likely to happen.
The data presented by Google Trends is not absolute but relative, which means they don't disclose the number of hits for the search query but instead represent search interest relative to the highest point on the chart. A value of 100 is the peak popularity for the term. A value of 50 means that the term is half as popular.
As of this writing, the highest point on the chart is for March 2020, right in the middle of the pandemic. But again, June 2022 looks like it may be on track to become the new peak data point. This shows us that people are not done panicking yet, and we should wait for more information once the data gets updated in July.
Conclusion
Here is the result we get when we overlay our 3 indicators in one picture:
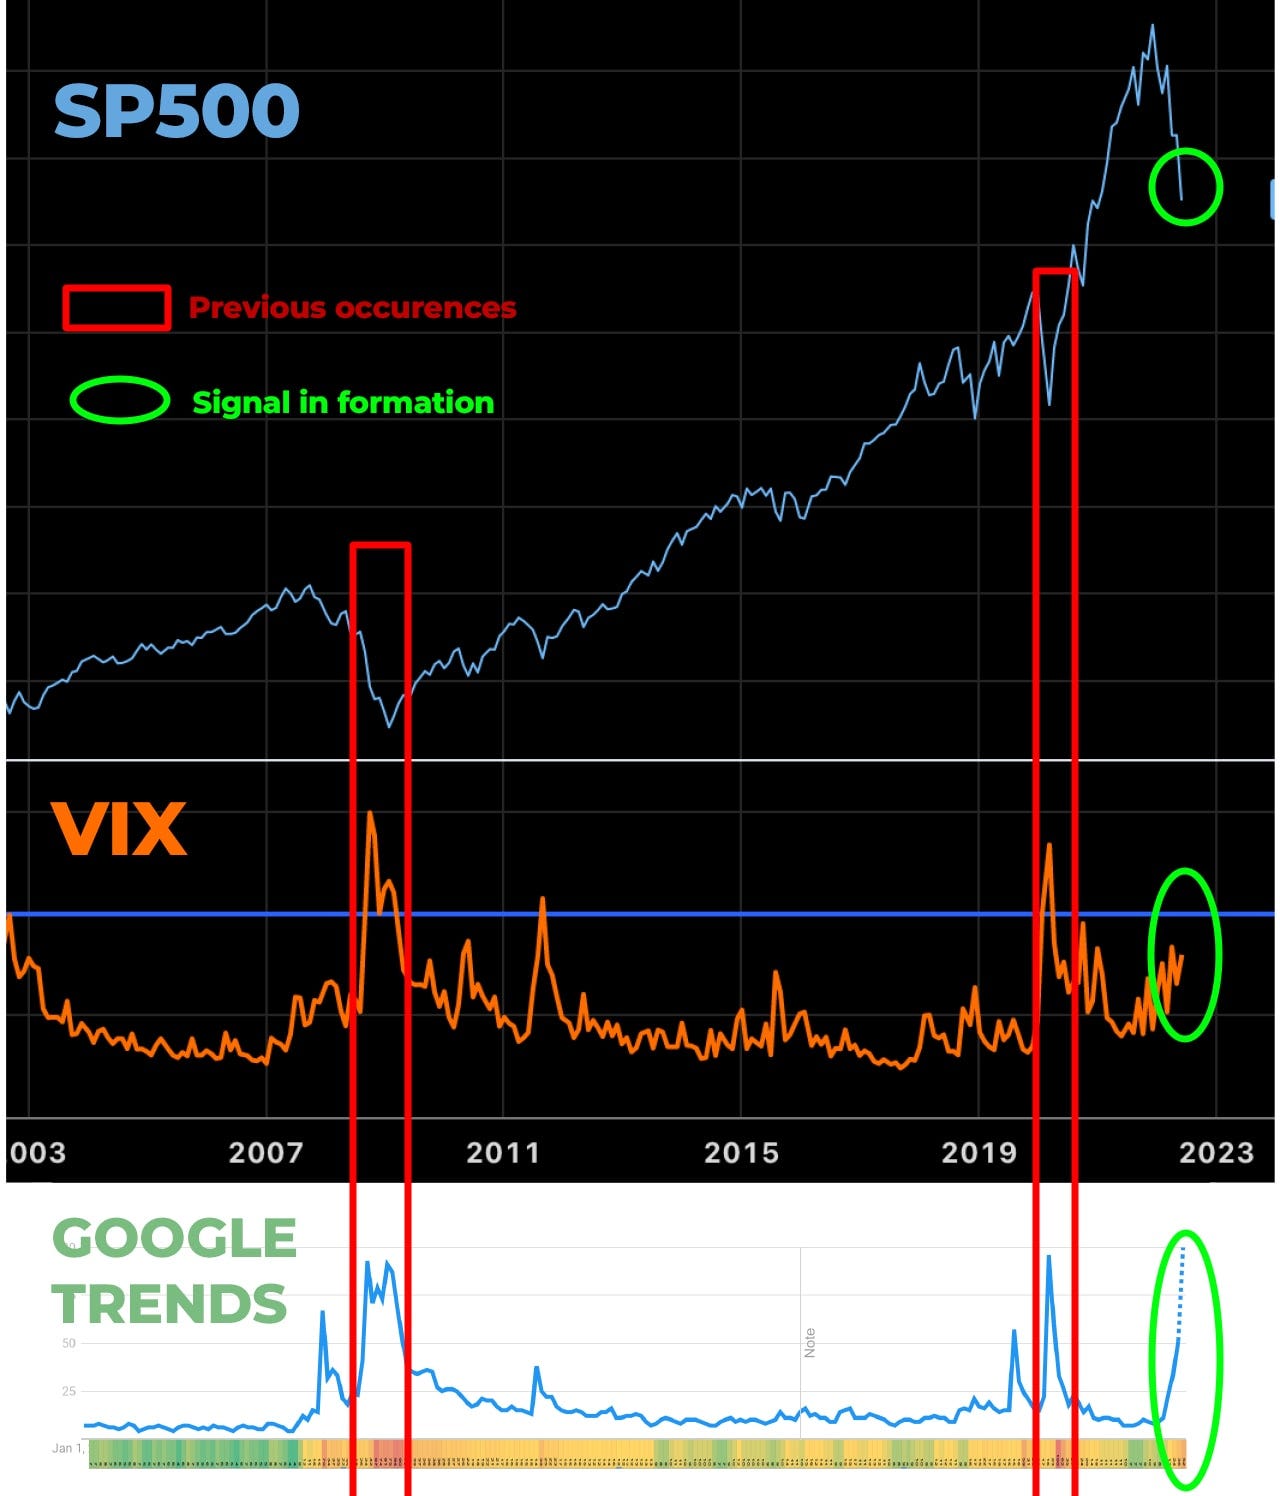
The colored timeline below the Google Trends graph is a heatmap of the same data. The redder it gets, the more people look up the term "recession". Once all 3 thresholds have been hit, there will be an opportunity for long-term profit:
- S&P 500 10% month-to-month drop
- VIX at 40–45
- Google trends spike for the term "recession" (heatmap becomes red)
When this happens, buying the S&P 500 at a discount and holding onto it for at least a year will most likely yield a positive return on investment, as history has previously shown.
Remember, I am not an expert and none of the insights contained in this article should be taken as financial advice. I'm not a "professional investor", I just like to play around with data and find patterns. That being said, if I turn out to be right in a few weeks/months, I might start calling myself a "Stock Expert", why not?
And if I turn out to be wrong, we'll just pretend I never wrote this article.
Thanks for reading, never invest money you can't afford to lose.
Comments
Post a Comment